Chemistry
Phase Diagram (P-T)
regions bounded by the sublimation, melting & vaporization curves
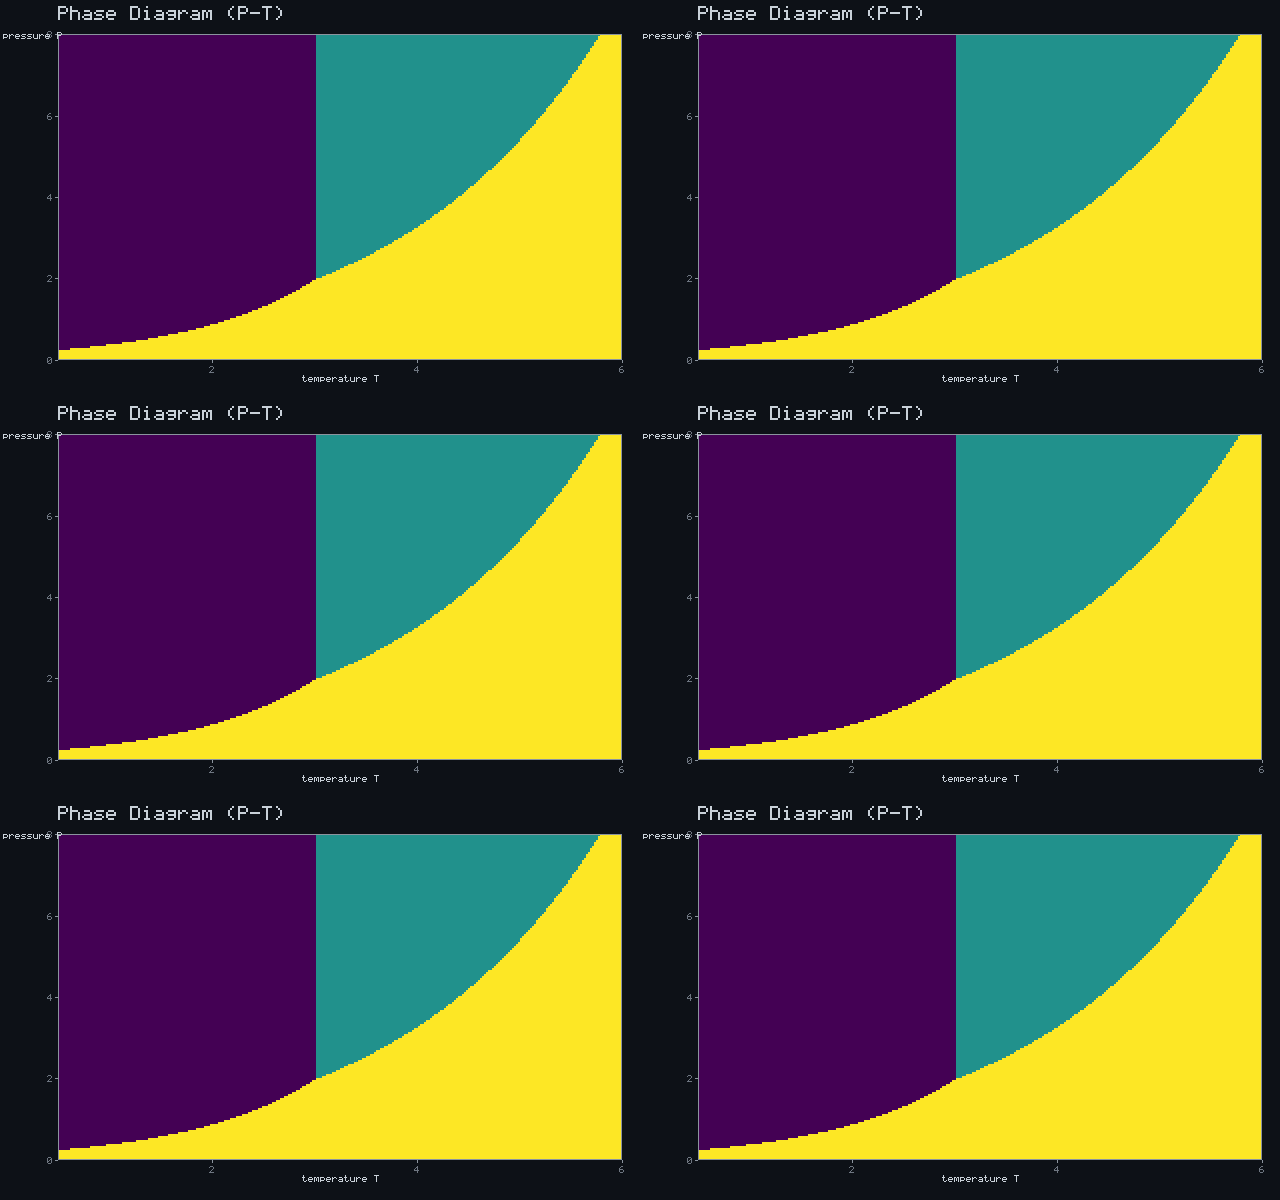
The plane splits into solid, liquid and gas fields whose phase-boundary curves all meet at the triple point near (3, 2).
Computed & rendered in pure C# on the frozen OnlyCSharp 1.8 library — animation baked to GIF with the library's own
Gif encoder (no GPU, no ffmpeg, no external packages).