Forestry & Wildlife
Home-Range Utilization (Kernel Density)
UD(x,y) = Σ e^(−rᵢ²/3)
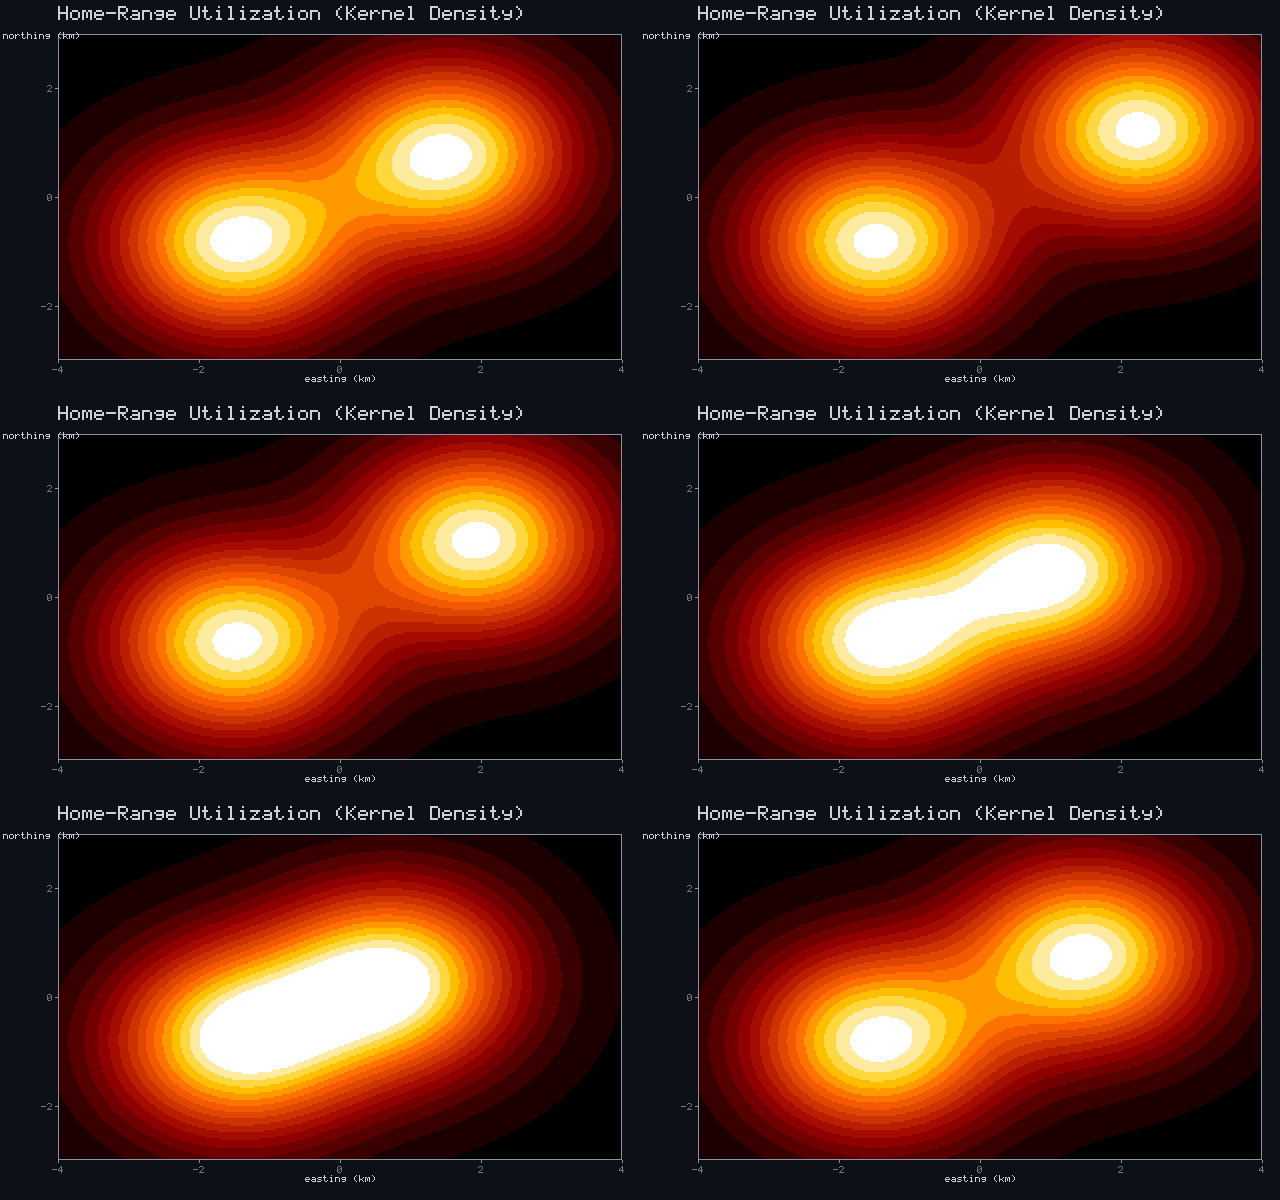
A kernel-density utilization distribution maps where an animal spends its time: two Gaussian activity cores — a fixed den and a foraging patch that wanders as the season shifts — glow over its home range.
Computed & rendered in pure C# on the frozen OnlyCSharp 1.8 library — animation baked to GIF with the library's own
Gif encoder (no GPU, no ffmpeg, no external packages).