Skip to content

World simulation - six scales, one engine

The weather falls out of the sunlight

Tilt sets the Sun's angle, the angle sets the insolation, the ocean soaks it up unevenly, the temperature gap makes pressure, pressure makes wind, wind lifts ocean water until it cools to rain. Every frame below is that causal chain solved in pure C# - the same insolation, tide, and geostrophic-wind formulas, run at a different zoom.

seasonal insolation geostrophic wind harmonic tides ocean thermal lag Zambretti forecast pure C# / BCL-only

Physically grounded, any place, any date. The astronomical spine is exact and computable forever - solar declination, the day/night terminator, and the M2/S2/K1/O1 tidal harmonics repeat deterministically for any latitude and calendar day. The chaotic parts (the rain of one specific afternoon) are not painted either: they are drawn as a reproducible sample from a place-and-date-seeded climate distribution, so the same coordinates and date always render the same sky.

Reused, not reinvented. The maths is OnlyCSharp 1.8 - Climatology.Insolation, the ZeroDEBM ocean-slab energy balance, TideAnalysis.Predict, MeteorologyFormulas.GeostrophicWind, SolarPosition/MoonPhase, and the Zambretti single-observer forecaster. The renderer is a thin CPU framebuffer over those numbers; nothing outside the .NET BCL, warnings-as-errors, GIF89a written by a from-scratch pure-stdlib encoder.
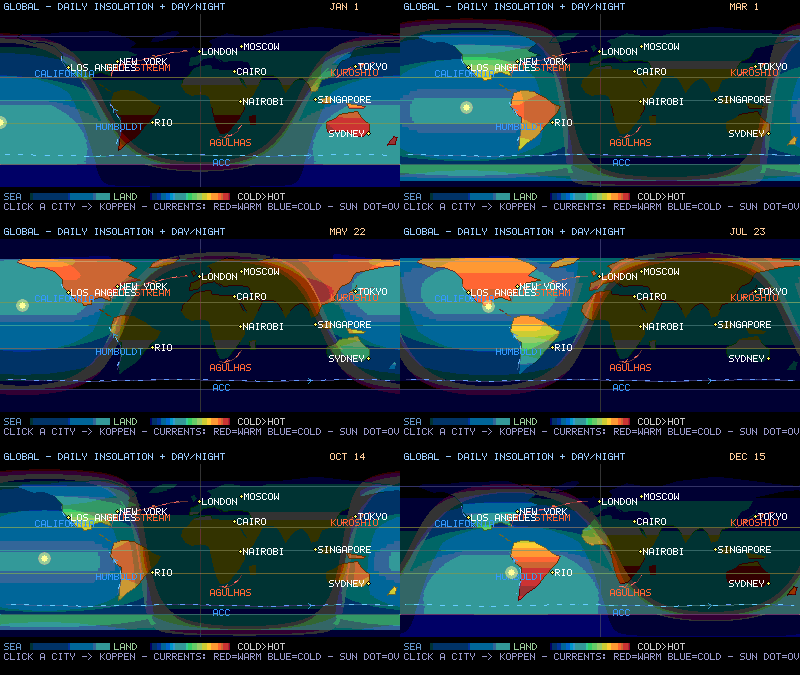
World map: land and sea shaded by daily insolation, the day/night terminator sweeping across, ocean currents and labelled cities
Global - insolation and the day/night terminator

A real-continent world map where land and sea are each shaded by the energy the Sun delivers that day. The terminator sweeps, the warm band marches north and south through the year, tropics and polar circles are marked, and warm/cold ocean currents (the Gulf Stream, the Humboldt) redistribute the heat that makes same-latitude coasts differ.

Technique: per-cell daily insolation from Climatology.Insolation.Earth(lat, dayOfYear), advancing solar declination, an ocean-current heat overlay, 18-frame year loop at 480x270.

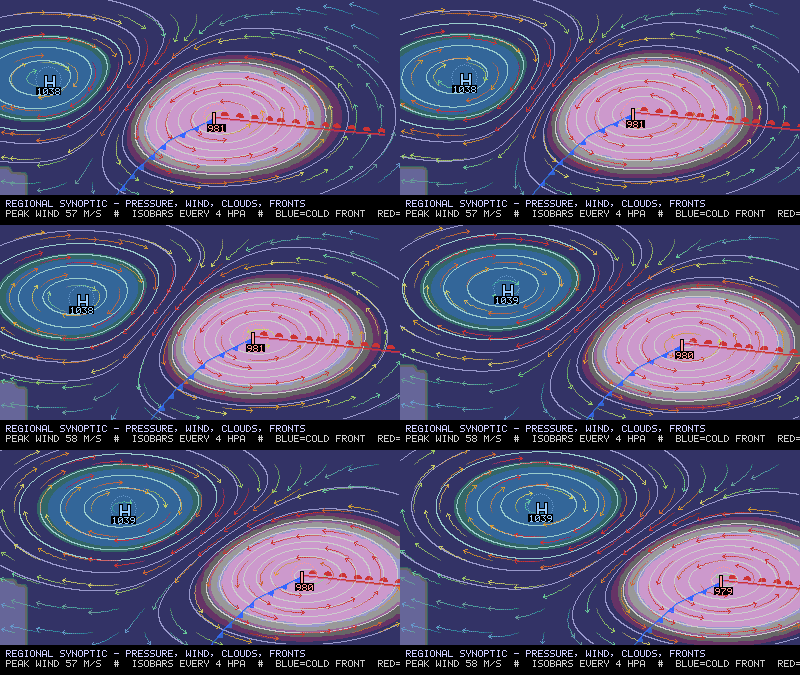
Synoptic weather chart: a drifting High and Low with closed isobars, speed-coloured wind streamlines, and a comma cloud
Regional - synoptic pressure and geostrophic wind

A drifting High and Low with smooth closed isobars, wind streamlines coloured by speed, and a comma cloud advected by the flow as it wraps the Low - a synoptic chart that moves.

Technique: pressure field to wind by MeteorologyFormulas.GeostrophicWind (Coriolis-balanced), streamline advection, cold/warm front tracing, isobars every 4 hPa.

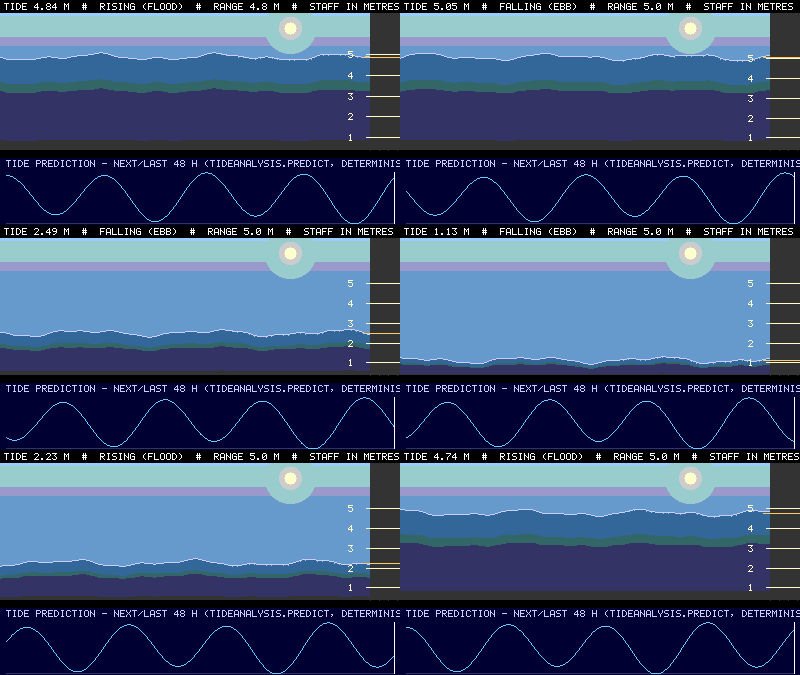
Tide gauge: water climbing and falling against a metre-marked sea wall, with a 48-hour harmonic tide-prediction chart scrolling below
Ocean - harmonic tide prediction

Water climbs and falls against a metre-marked sea wall while a 48-hour forecast scrolls beneath it with a live "now" cursor. It is astronomy, not noise: deterministic and repeatable forever.

Technique: TideAnalysis.Predict summing the M2/S2/K1/O1 tidal constituents into a sea-level curve - the same harmonics real tide tables use.

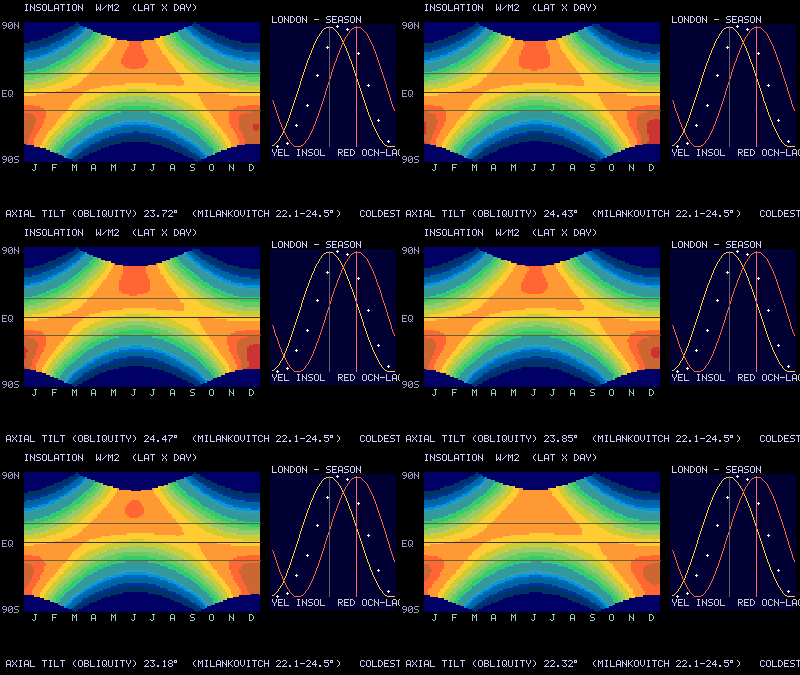
Latitude-by-day insolation heatmap with cycling axial tilt, plus London's raw insolation versus its ocean-lagged temperature curve
Climate - insolation heatmap and the ocean lag

A latitude-by-day heatmap of incoming sunlight with the axial tilt cycling across its Milankovitch range (22.1 to 24.5 degrees), beside London's raw insolation (yellow) against its ocean-buffered temperature (red) - the reason the coldest days lag the solstice.

Technique: the ZeroDEBM.WithOceanSlab energy balance giving the sea's heat capacity a memory, over the full insolation grid.

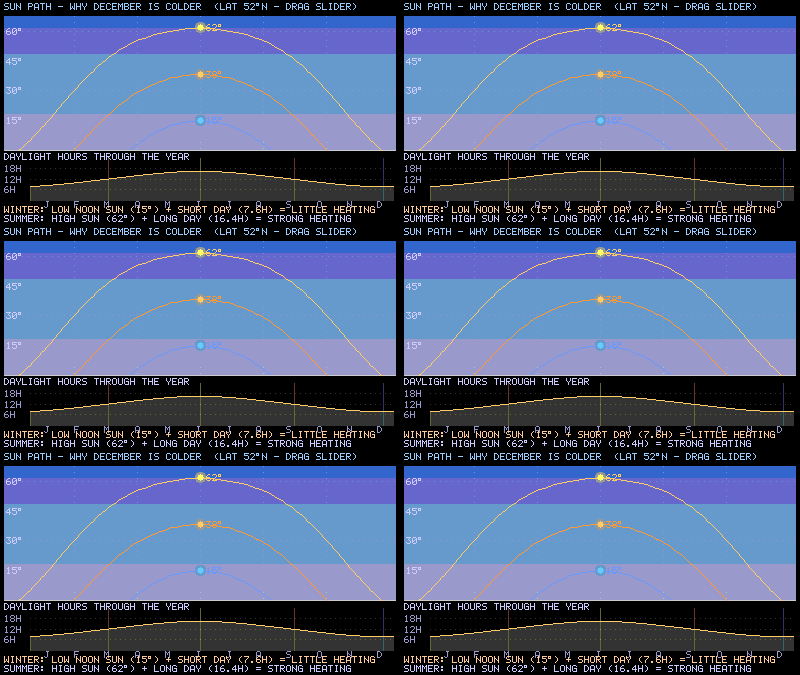
The Sun's arc across the sky at the two solstices and the equinox, with a day-length-through-the-year curve below
Sun path - why December is colder

The Sun's arc drawn at the solstices and the equinox for a chosen latitude: a low, brief winter arc versus a high, long summer one. Glancing rays over a short day is little heating; steep rays over a long day is a lot - distance never enters it.

Technique: SolarPosition altitude/azimuth across the day, plus the day-length integral over the year.

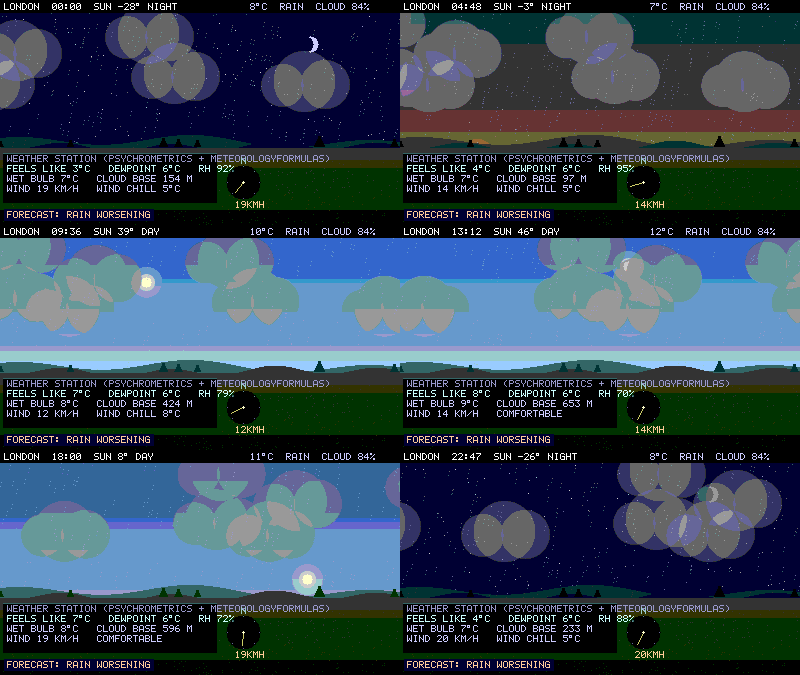
One animated day at London: sky gradient with sunset band, glowing Sun and crescent Moon, clouds and rain, with a weather-station readout and Zambretti forecast
Local - one day, with a Zambretti forecast

A full animated day over London: the sky gradient warming into a sunset band, a glowing Sun and a phase-shaded crescent Moon, drifting cloud and rain, and a weather-station panel reading out feels-like, dew point, cloud base, and a plain-language forecast.

Technique: SolarPosition/MoonPhase for the sky, psychrometrics for the dew-point and lifting-condensation cloud base, and the Zambretti single-observer forecaster for the verdict.